Navigation

  • index
  • next |
  • previous |
  • pyam 0.1.0 documentation »

Examples

Some examples of pyam’s tools, features, and plotting capabilities.

../_images/sphx_glr_plot_timeseries_thumb.png

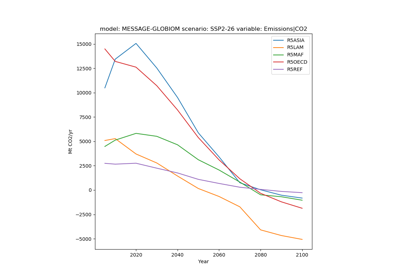
Plot Timeseries Data
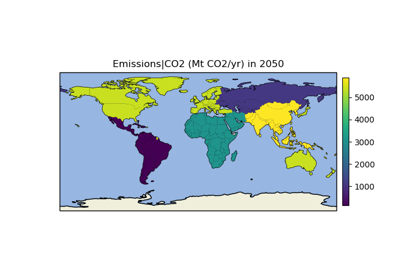
../_images/sphx_glr_plot_regions_thumb.png

Plot Regional Data

../_images/sphx_glr_plot_stack_thumb.png

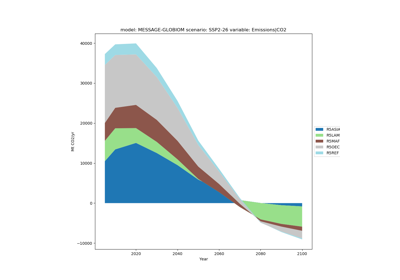
Plot Data as a Stack Plot

../_images/sphx_glr_plot_pie_thumb.png

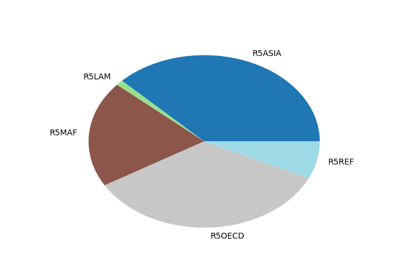
Plot Data as a Pie Chart

../_images/sphx_glr_plot_bar_thumb.png

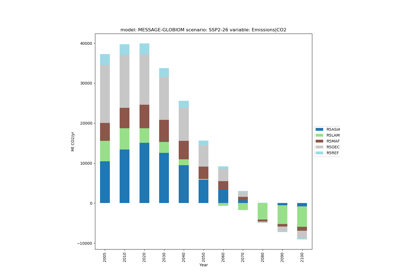
Plot Data as a Bar Plot

Download all examples in Python source code: examples_python.zip
Download all examples in Jupyter notebooks: examples_jupyter.zip

Gallery generated by Sphinx-Gallery

Table Of Contents

  • Class IamDataFrame
  • Useful pyam functions
  • Auxiliary timeseries functions
  • Examples

This Page

  • Show Source

Quick search

© Copyright 2017-2018, Matthew Gidden & Daniel Huppmann @ IIASA Energy Program.